Integrations and Component Architecture
LiveNX
LiveNX is a network and application performance monitoring platform with patented end-to-end visualization for a global view of the network and the ability to drill-down to individual devices. Using LiveNX, enterprises gain real- time and continuous insight into network traffic based on application and user level activity. LiveNX offers the ability to gather and analyze volumes of network data at scale from every device, application and user to reduce mean time to repair, and it performs exploratory and explanatory analysis.
Omnipeek
• Deep packet analysis
• Vast library of decoders
• Expert system – suggested causes
LiveUX
LiveUX monitors end-user experience of web applications. By combining the end-user experience metrics with the network performance monitoring information, you can quickly triage performance issues.
• Integrated LiveNX and LiveUX dashboard for instant visibility of site health, network devices, application usage, and application performance (incl. Unified Communications).
• Quickly identify the sites that are experiencing performance degradation and the applications impacted
• From the site, drill down to examine network conditions including bandwidth utilization, link errors, QoS metrics and applications that are competing for the bandwidth
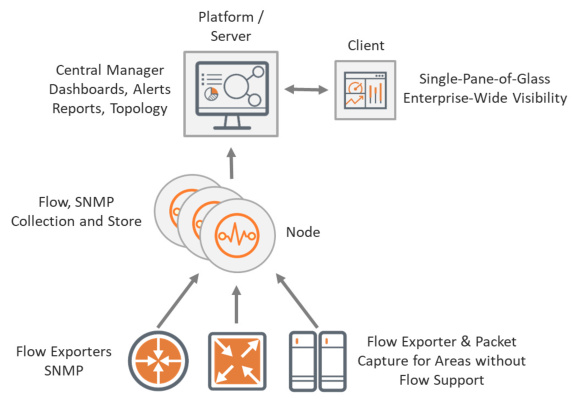
LiveNX Monitor of Monitors
LiveNX Monitor of Monitors provides a single-pane-of-glass for server settings, system health, sites and configuration, aggregating multiple geographical or organizationally segmented LiveNX domains. Through an aggregation layer, each LiveNX server domain instance injects relevant data for summary dashboard views and management by way of a north-bound REST API.